
Politifact’s Louis Jacobson has created a visualization that shows the downfall of President Donald Trump’s economic chops during his first 100 days.
In a Monday report, Jacobson noted that 100 days isn’t long enough to accumulate a lot of economic data, but there is information available on things like “consumer confidence, business expectations, inflation forecasts, and the stock market”
Presenting nine charts displaying the issues, Jacobson said there is “widespread concern about where the U.S. economy is headed under his policies, especially his sharp tariff increases.”
Meanwhile, he noted that the stock market’s April performance was “its worst since 1932, when the U.S. was in the midst of the Great Depression.”
ALSO READ: Trump is about to target something far more terrifying than tariffs
Two surveys on consumer confidence, one from the University of Michigan and the other from the Conference Board, show that in March, Trump fell below even the worst months in President Joe Biden’s administration. The only month where things were worse for Biden was January 2021, when Biden was sworn in with 11 days left in the month.
Meanwhile, Americans’ fear of inflation worsening is higher in April 2025 than at any point during Biden’s presidency.
This data is in addition to the financial markets and general anxiety or pessimism about the future of the market.
The information comes amid a new NBC News poll, “Stay Tuned,” that shows a majority of American adults (55%) disapprove of Trump’s job performance in the first 100 days.
Over 40% of those disapproval numbers come from those who “strongly disapprove of the job” Trump is doing.
See a few charts below.
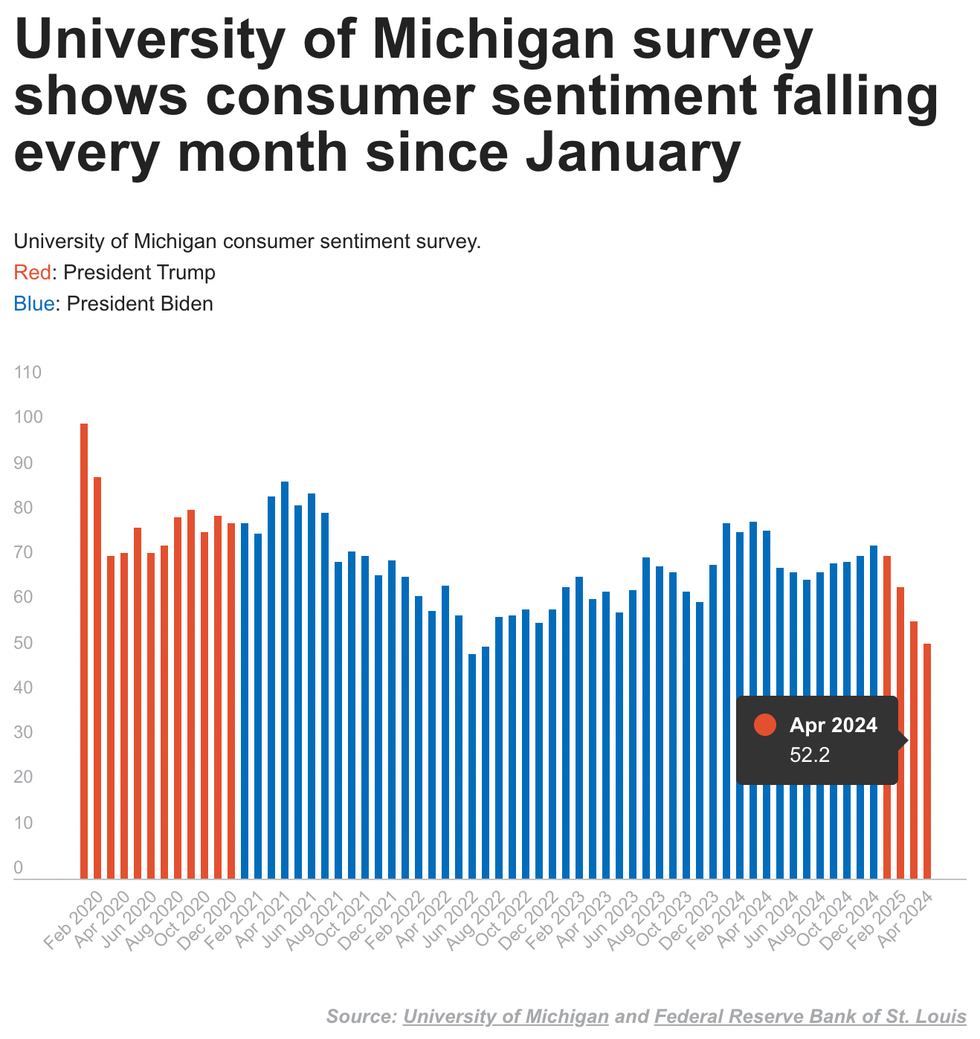
Politifact chart from University of Michigan and Federal Reserve Bank of St. Louis
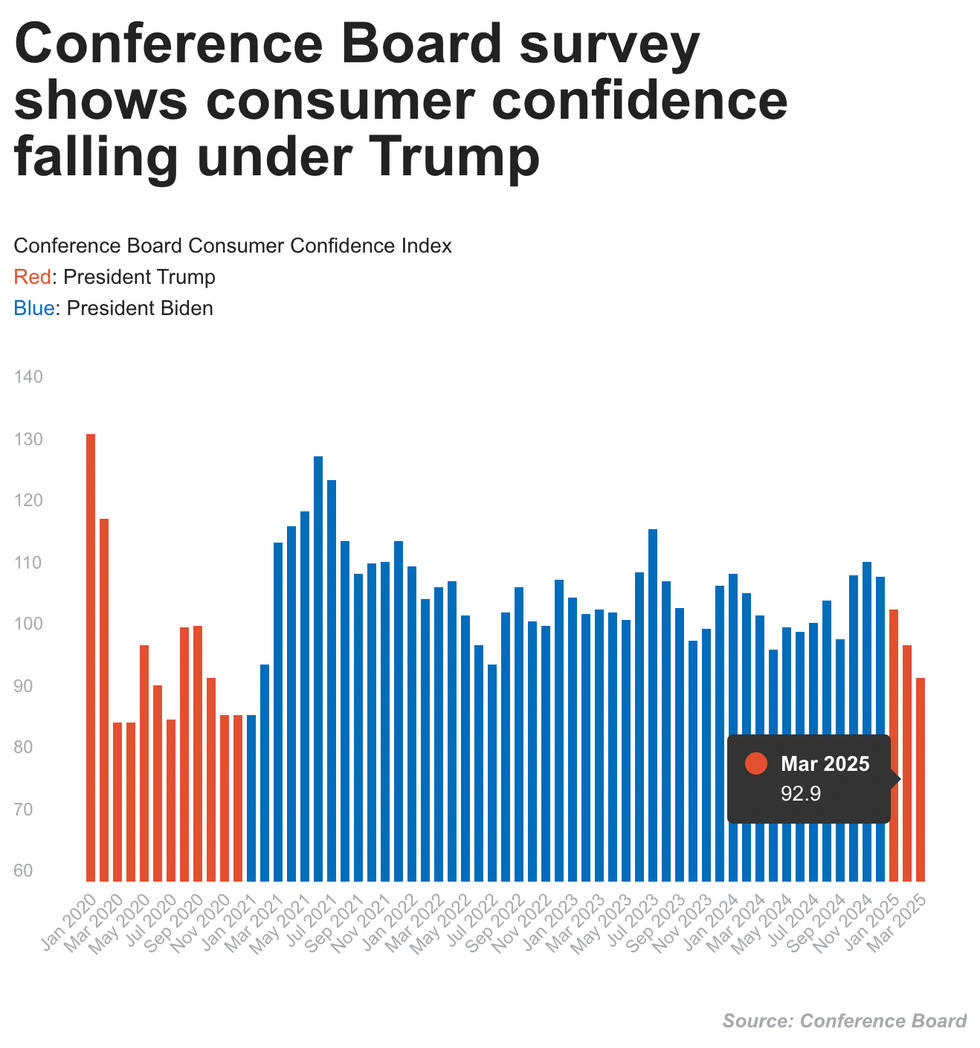
Politifact chart from Conference Board